Proportional representation vs First past post voting Modelling for fun and profit
In this post I will explore the different voting systems via simulation. For this we need voters and parties and then we simulate the number of votes each party from election to election. Naively we would expect voters to vote for the party whose viewpoint is the closest to the viewpoint of the voter. For simplicity we will assume here that a viewpoint is basically a simple variable defining their position on the political spectrum (far left to far right). Later we will look more into multidimensional viewpoints.
Voting
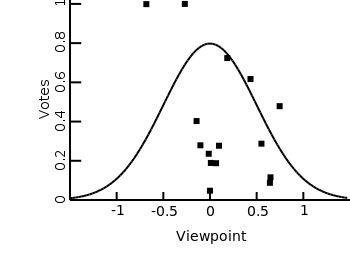
Here I’ve shown the outcome of one round of voting, where everyone votes for the party whose viewpoint is closest to theirs. Interestingly, one of the biggest parties is on the fringe here, because all the voters that are further to the left vote for that party. This means that even though most voters are central, “fringe” parties can get a relatively large presence because they cater to a wider spectrum of the political landscape.
Taking power into account
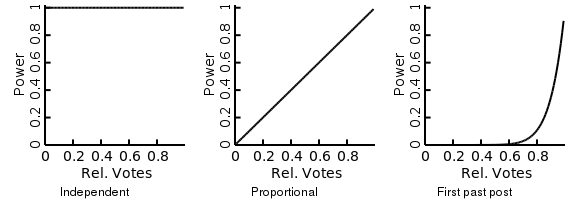
The previous example assumed that people will actually just vote on the party whose viewpoint is most closely aligned with their own viewpoint. Of course people will also take into account whether the party they vote for has a lot of power/influence. Here is were the difference between the voting systems come in. Illustrated above are some possible scenarios. 1) People’s decision is completely independent of the amount of votes 2) The power of a given party is proportional to the number of votes they received 3) Parties with high number of votes have a disproportionally large amount of power. In a pure first past the post system only the party with the most votes has any power. Here I chose a less extreme form of first past the post. This represents the fact that even if only the largest party has any power, when you vote you will not know which party will end up the larger party. Only that the currently larger parties are more likely to become the largest party after voting.
Number of parties
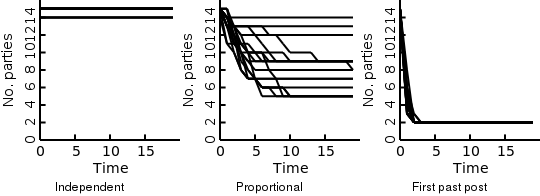
If we now simulate the number of parties over a couple of elections we will see that indeed the first past the post system ends up with the least (two) amount of parties. Proportional representation ends up with a higher number of parties. The exact amount of parties is dependent on the mix of parties (and their viewpoints) present at the start.
Possible next posts
In this post I had a quick look at different democratic voting systems and their results for the number of parties present over time. I hope to take a more in depth look over different possible aspects in future posts. Some things I want to look at are:
- How should rational people vote? Here I just assumed people would weigh their viewpoint by the amount of influence a party will have. It should be possible though to be more exact in how people would weigh these different factors.
- Evolving parties. Parties change their viewpoint over time in response to voters. This should also influence voting behaviour.
- Multidimensional political axes. For simplicity I assumed one political axis here (i.e. left to right wing). In reality the world is not that simple though.